matplotlib 学习笔记 
关于这份笔记…
- python 的 matplotlib 库,用于制作图表的强大工具,
主要是普物实验还用得上欸 - 参考了官方教程与《Python 编程——从入门到实践》一书的部分内容。
基本内容 
运行的基本方式 
首先当然得有 matplotlib 库哈
pip install matplotlib
然后是代码:
import matplotlib as mpl
import matplotlib.pyplot as plt
import numpy as np
fig, ax = plt.subplots()  # Create a figure containing a single axes.
ax.plot([1, 2, 3, 4], [1, 4, 2, 3])  # Plot some data on the axes.
结果如下图:

此外还有另一种写法:
import matplotlib.pyplot as plt
plt.plot([1, 2, 3, 4], [1, 4, 2, 3])
plt.show()
使用plot函数绘制折线图,使用scatter函数绘制散点图,使用bar函数绘制直方图
前者显式创建了 Figure 和 Axes 对象,并调用了它们(即“面向对象 (OO) 风格”),而后者依靠 pyplot 隐式创建和管理图形和坐标轴,并使用 pyplot 函数进行绘图。
官方文档
In general, we suggest using the OO style, particularly for complicated plots, and functions and scripts that are intended to be reused as part of a larger project. However, the pyplot style can be very convenient for quick interactive work.
官方建议在面对复杂绘图时使用 OO 风格 但是像我这种水平也妹有画很复杂的图的时候所以其实大概关系不大(
不过对 plt 中的各个对象的了解还是很有必要的
各个对象的含义 

Figure
即整个图像。创建方法fig = plt.figure(),可以设置figsize参数调整图像大小。
Axes
官方文档
An Axes is an Artist attached to a Figure that contains a region for plotting data, and usually includes two (or three in the case of 3D) Axis objects (be aware of the difference between Axes and Axis) that provide ticks and tick labels to provide scales for the data in the Axes. Each Axes also has a title (set via set_title()), an x-label (set via set_xlabel()), and a y-label set via set_ylabel()).
虽然 Axes 字面意思上是 "Axis" 的复数形式,但在这里 Axes 所包含的并非仅仅是坐标轴。可以把 Axes 理解为你要放到画布上的各个物体,且 Axes 下可以修改编辑的变量非常多,基本上能满足所有作图需求。
Axis
坐标轴,可以设置位置与标签。创建方法ax.axis([x1, x2, y1, y2])或plt.axis([x1, x2, y1, y2])。刻度的位置由Locator对象确定,刻度标签字符串由Formatter格式化。正确的Locator和Formatter的组合可以很好地控制刻度位置和标签。
Artist
上述的以及图中可见的内容几乎都是一个Artist。
输入数据类型 
官方文档
Plotting functions expect numpy.array or numpy.ma.masked_array as input, or objects that can be passed to numpy.asarray. Classes that are similar to arrays ('array-like') such as pandas data objects and numpy.matrix may not work as intended. Common convention is to convert these to numpy.array objects prior to plotting
总之就是传入可以被当作 array 的对象。当然 list 就可以直接用。建议使用 Numpy 以解锁更多操作 ~
此外还支持了可寻址对象例如 dict。官方给出的示例代码:
np.random.seed(19680801)  # seed the random number generator.
data = {'a': np.arange(50),
        'c': np.random.randint(0, 50, 50),
        'd': np.random.randn(50)}
data['b'] = data['a'] + 10 * np.random.randn(50)
data['d'] = np.abs(data['d']) * 100

fig, ax = plt.subplots(figsize=(5, 2.7), layout='constrained')
ax.scatter('a', 'b', c='c', s='d', data=data)
ax.set_xlabel('entry a')
ax.set_ylabel('entry b')

玩得还挺花是不是(
细节处理 
修改颜色 
折线图 
调用plot函数时修改color参数即可。
散点图 
同样在scatter函数内修改参数,不过散点图有散点的内部颜色facecolor与边缘的颜色edgecolor,两者的颜色可以不同。
颜色的表示 
Matplotlib 支持多种方式的颜色表示包括 RGB/RGBA 元组、RGB/RGBA 十六进制字符串、[0, 1] 之间的灰度值(注意是字符串
'b' as blue
'g' as green
'r' as red
'c' as cyan
'm' as magenta
'y' as yellow
'k' as black
'w' as white
修改线宽、线型与标记的大小 
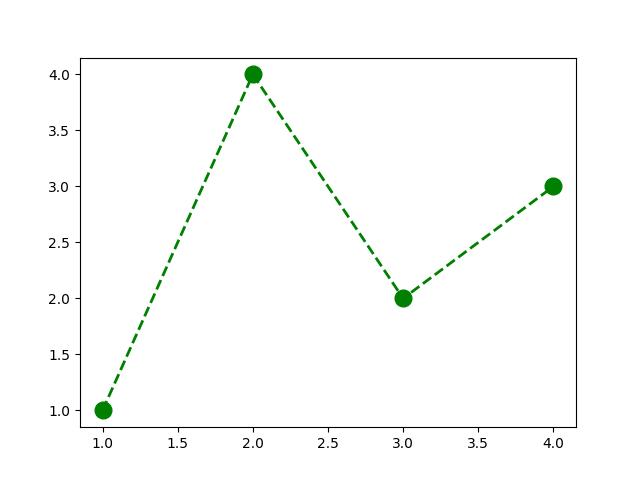
plot函数内设置参数marker、linestyle、linewidth与markersize
例如:
plot(x, y, color='green', marker='o', linestyle='dashed', linewidth=2, markersize=12)
样式如下图:
Note
此处传入的参数还可以改成'go--',其中 'g' 为颜色,'o' 为标记样式,'--' 表示线的形状。既方便又形象有没有 ~
线型的表示 
'solid'or(0, ())or'-': 实线'dotted'or(0, (1, 1))or':': 点线'dashed'or'--': 短划线'dashdot'or'-.': 点划线
上面出现的形如'(offset, (on_off-seq))'的表示方法使线型更为多样。例如,(0, (3, 10, 1, 15))表示(3pt 线,10pt 空间,1pt 线,15pt 空间)没有偏移,而(5, (10, 3))表示(10pt 线,3pt 空间),但跳过第一个 5pt 线。
标记样式的表示 
标记样式还是很多的(见官网)比较有用的基本上就那么几个:
'.'点
'o'圆
'^'三角形
'v'倒三角形
's'正方形
'*'五角星
'D'正方形转 45°
'd'菱形
','像素
'x'叉
上面除了最后两个以外都是“Filled markers”,这些标记可以设置填充样式fillstyle(包括'full'、'left'、'right'、'bottom'、'top''none')
Note
marker 还可以使用'$...$'的形式来使用 mathtex 呈现字符串。例如"$f$"表示显示字母f的标记。
还有很多 花里胡哨的 样式就不写了
设置标签 
设置轴标签与文本 
在显式 API(即 OO 风格)中使用set_xlabel、set_ylabel、set_title、text、annotate等函数在指定位置添加文本。
在隐式 API(即使用 plt 的方式)中使用xlabel、ylabel、title、suptitle、text、figtext、annotate等函数。其中title、text、annotate用于修改Axes中的文本,suptitle、figtext用于修改Figure中的文本。
虽然平时 Figure 跟 Axes 差别不大啦
附上官方的演示代码:
import matplotlib
import matplotlib.pyplot as plt

fig = plt.figure()
ax = fig.add_subplot()
fig.subplots_adjust(top=0.85)

# Set titles for the figure and the subplot respectively
fig.suptitle('bold figure suptitle', fontsize=14, fontweight='bold')
ax.set_title('axes title')

ax.set_xlabel('xlabel')
ax.set_ylabel('ylabel')

# Set both x- and y-axis limits to [0, 10] instead of default [0, 1]
ax.axis([0, 10, 0, 10])

ax.text(3, 8, 'boxed italics text in data coords', style='italic',
        bbox={'facecolor': 'red', 'alpha': 0.5, 'pad': 10})

ax.text(2, 6, r'an equation: $E=mc^2$', fontsize=15)

ax.text(3, 2, 'Unicode: Institut für Festkörperphysik')

ax.text(0.95, 0.01, 'colored text in axes coords',
        verticalalignment='bottom', horizontalalignment='right',
        transform=ax.transAxes,
        color='green', fontsize=15)

ax.plot([2], [1], 'o')
ax.annotate('annotate', xy=(2, 1), xytext=(3, 4),
            arrowprops=dict(facecolor='black', shrink=0.05))

plt.show()
结果如下:
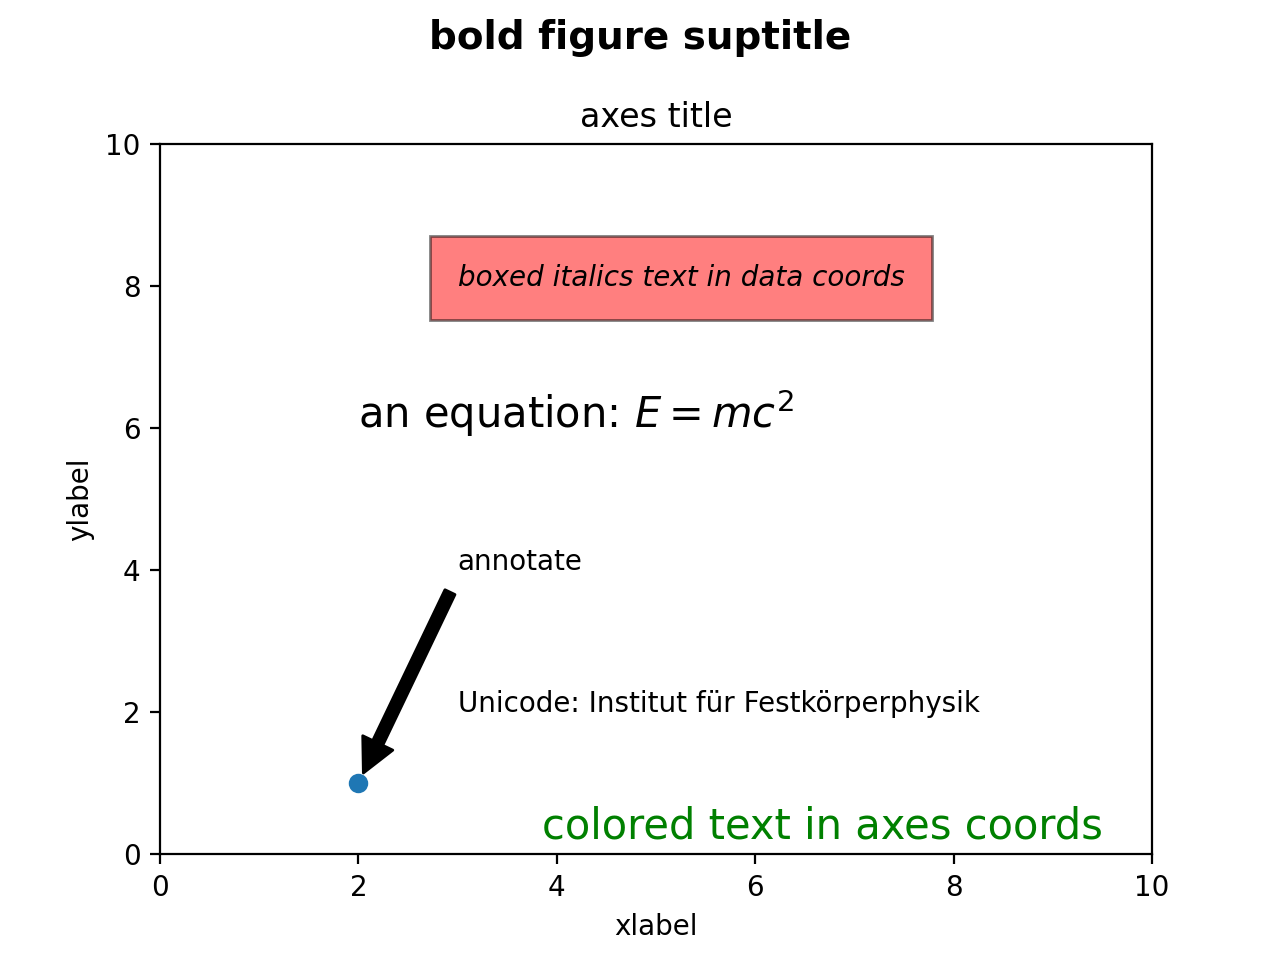
上面的例子基本上就把所有可用的函数都用上了,其实很多也不太常用 所以大多不再细究。
其中在设置坐标轴的标签时,x 和 y 标签会自动放置,要移动标签可以指定关键字labelpad的参数(单位为 pt),或者使用position参数(格式(x, y))改变位置。
注意
无法使用position参数修改 x 标签的 y 坐标或 y 标签的 x 坐标。如要修改,请使用labelpad。
设置标题与设置标签的方式大致相同,但也可以使用loc参数('center'、'left'或'right')设置标题位置与对齐方式,垂直间距则用pad参数控制。
修改字体 
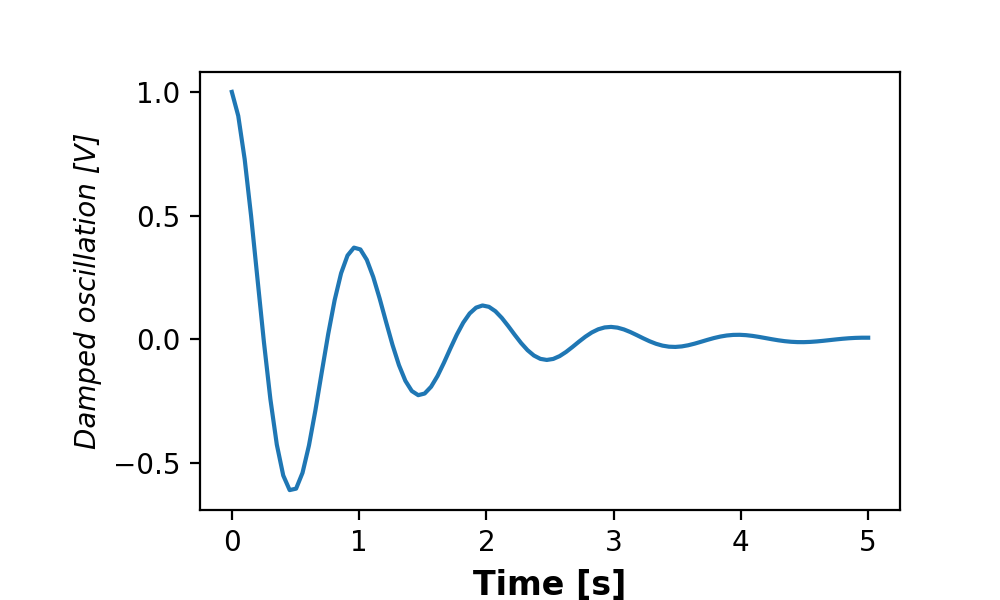
可以通过操作matplotlib.font_manager.FontProperties方法或通过set_xlabel的命名关键字参数来更改
示例代码:
from matplotlib.font_manager import FontProperties

font = FontProperties()
font.set_family('serif')
font.set_name('Times New Roman')
font.set_style('italic')

fig, ax = plt.subplots(figsize=(5, 3))
fig.subplots_adjust(bottom=0.15, left=0.2)
ax.plot(x1, y1)
ax.set_xlabel('Time [s]', fontsize='large', fontweight='bold')
ax.set_ylabel('Damped oscillation [V]', fontproperties=font)

plt.show()
结果如下:
如何知道我有哪些字体?
在终端使用fc-list命令。还可以使用fc-list :lang=zh family命令查看有哪些支持中文的字体。
设置刻度与刻度标签 
除线性标度以外,Matplotlib 还提供非线性标度如对数标度,使用set_xscale与set_xscale来改变标度。支持的标度有'log' , 'symlog' , 'logit'等等。同时支持自定义函数标度,例如:
def forward(x):
    return x**(1/2)

def inverse(x):
    return x**2

ax.set_yscale('function', functions=(forward, inverse))
标度则为\(f(x)=x^\frac{1}{2}\)。
当需要修改刻度的格式与标签时,建议使用库 中的locat or 与 formatter。
这部分基本上也是没啥用,下次再补上好了(
Update 2023.4.20
在万用表的设计里头还真用上了🤡
此处最有用的部分应该是设置刻度的有效位数等数据,你可以自己生成一个格式字符串列表然后直接用xaxis.set_ticks和xaxis.set_ticklabels但是官方并不建议这样做,因为这破坏了“交互式导航”并重置了坐标轴的限制范围。
简单的方法是使用格式字符串matplotlib.ticker.StrMethodFormatter(新式格式字符串)或matplotlib.ticker.FormatStrFormatter( 旧式' %' 格式字符串),其中新式的可以直接用字符串表示 而不需要写前面这么一长串玩意.
例如:
fig, axs = plt.subplots(2, 1, figsize=(5, 3), tight_layout=True)
axs[0].plot(x1, y1)
axs[1].plot(x1, y1)
ticks = np.arange(0., 8.1, 2.)
axs[1].xaxis.set_ticks(ticks)
axs[1].xaxis.set_major_formatter('{x:1.1f}')
axs[1].set_xlim(axs[0].get_xlim())
plt.show()
结果如下:
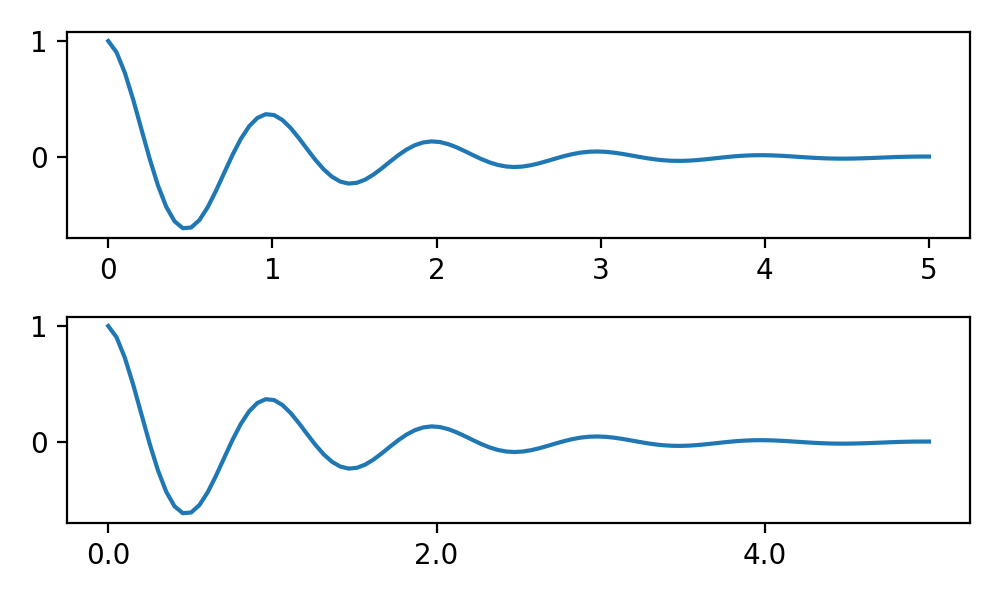
其中axs[1].xaxis.set_ticks(ticks)设置了刻度,axs[1].xaxis.set_major_formatter('{x:1.1f}')使用新式格式字符串设置了刻度标签并设为保留小数点后一位,axs[1].set_xlim(axs[0].get_xlim())设 置 了 x 轴的显示范围。
这里其余 的就TO DO 好了(
使用数学表达式 
可以使用 \(\TeX\) 进行渲染。例如用ax.set_title(r'$\sigma_i=15$')来表示 \(\sigma_i=15\) 。其中r表示这是一个原始字符串 (raw string),于是反斜杠不会被视作转义字符。
注释 
上文已出现过,就是通过一个箭头从xytext处连接到xy处
fig, ax = plt.subplots(figsize=(5, 2.7))

t = np.arange(0.0, 5.0, 0.01)
s = np.cos(2 * np.pi * t)
line, = ax.plot(t, s, lw=2)

ax.annotate('local max', xy=(2, 1), xytext=(3, 1.5),
            arrowprops=dict(facecolor='black', shrink=0.05))

ax.set_ylim(-2, 2)
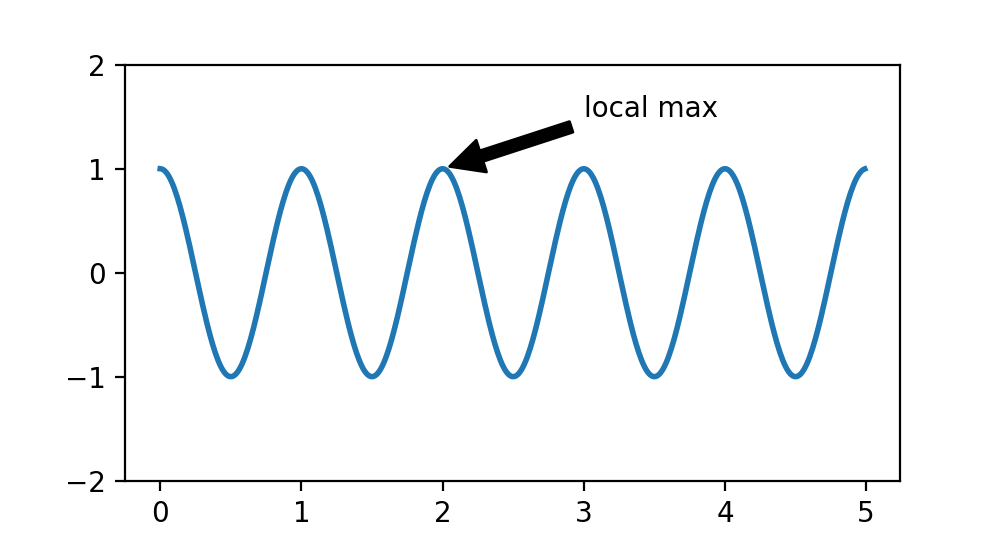
xy与xytext还可以有其他坐标系可供选择,不再赘述。
图例 
使用legend函数。
设置图例位置 
在legend函数内修改loc参数。支持的参数有'upper left', 'upper right', 'lower left', 'lower right'(放置在相应角上)'upper center', 'lower center', 'center left', 'center right'( 放置在边缘 中 心 ) 'center'以及'best',默认值为'best'。
在绘图时将layout参数设为'constrained'并在loc参数开头指定'outside',可以将图例绘制在Axes之外。
fig, axs = plt.subplot_mosaic([['left', 'right']], layout='constrained')

axs['left'].plot([1, 2, 3], label="test1")
axs['left'].plot([3, 2, 1], label="test2")

axs['right'].plot([1, 2, 3], 'C2', label="test3")
axs['right'].plot([3, 2, 1], 'C3', label="test4")
# Place a legend to the right of this smaller subplot.
fig.legend(loc='outside upper right')
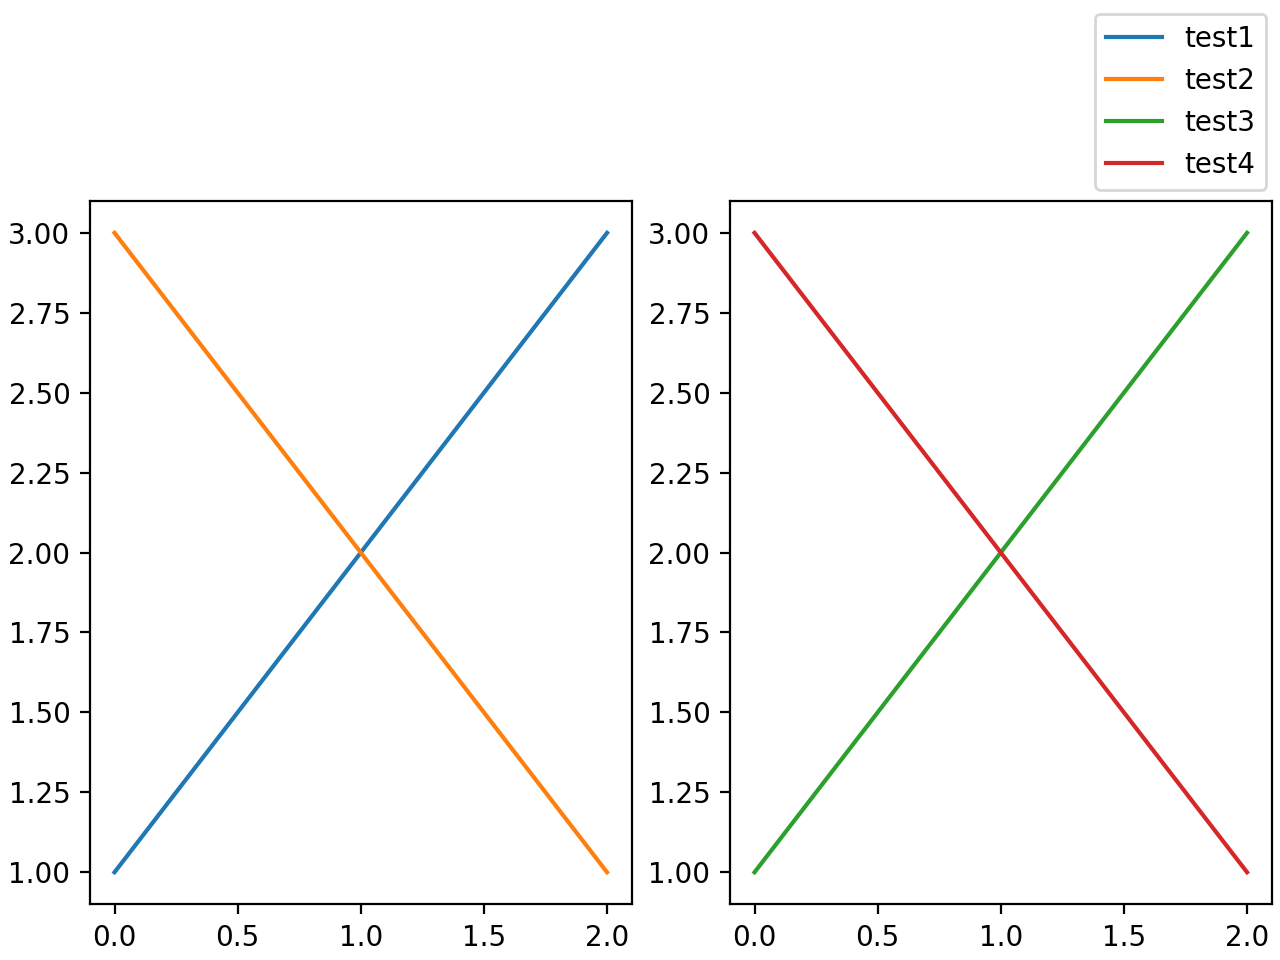
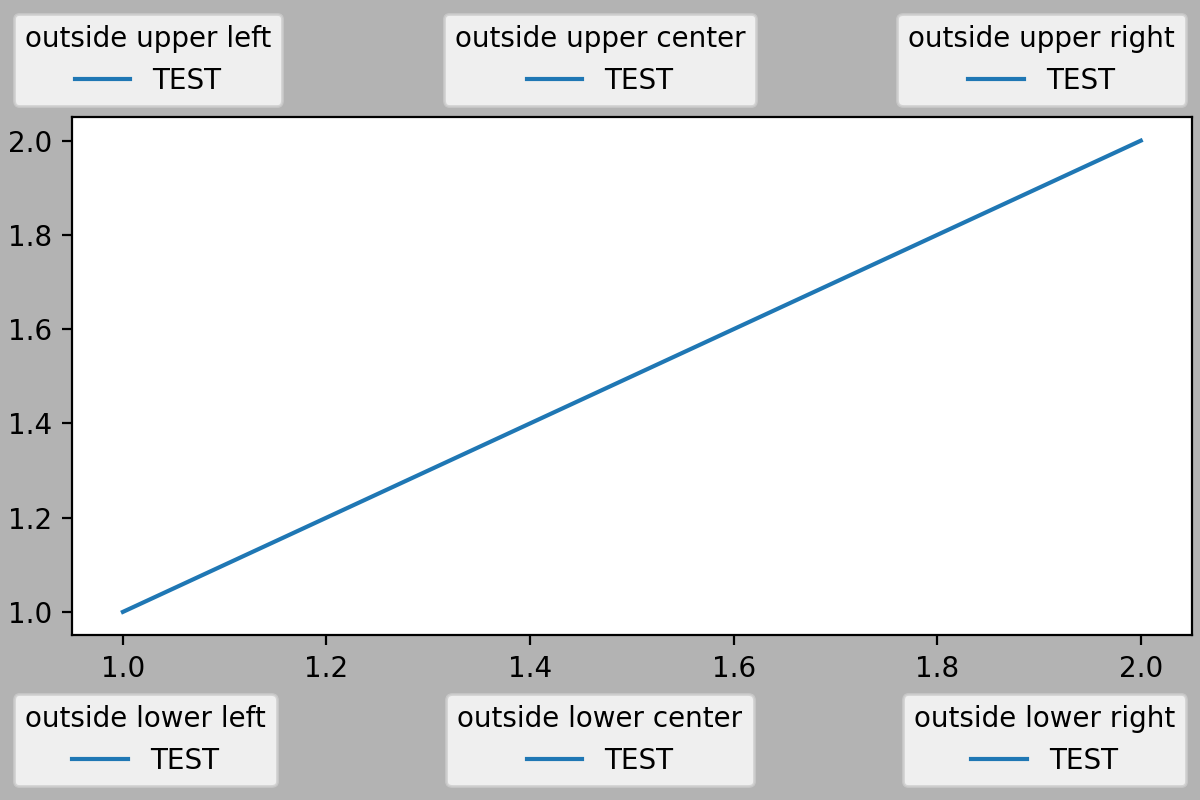
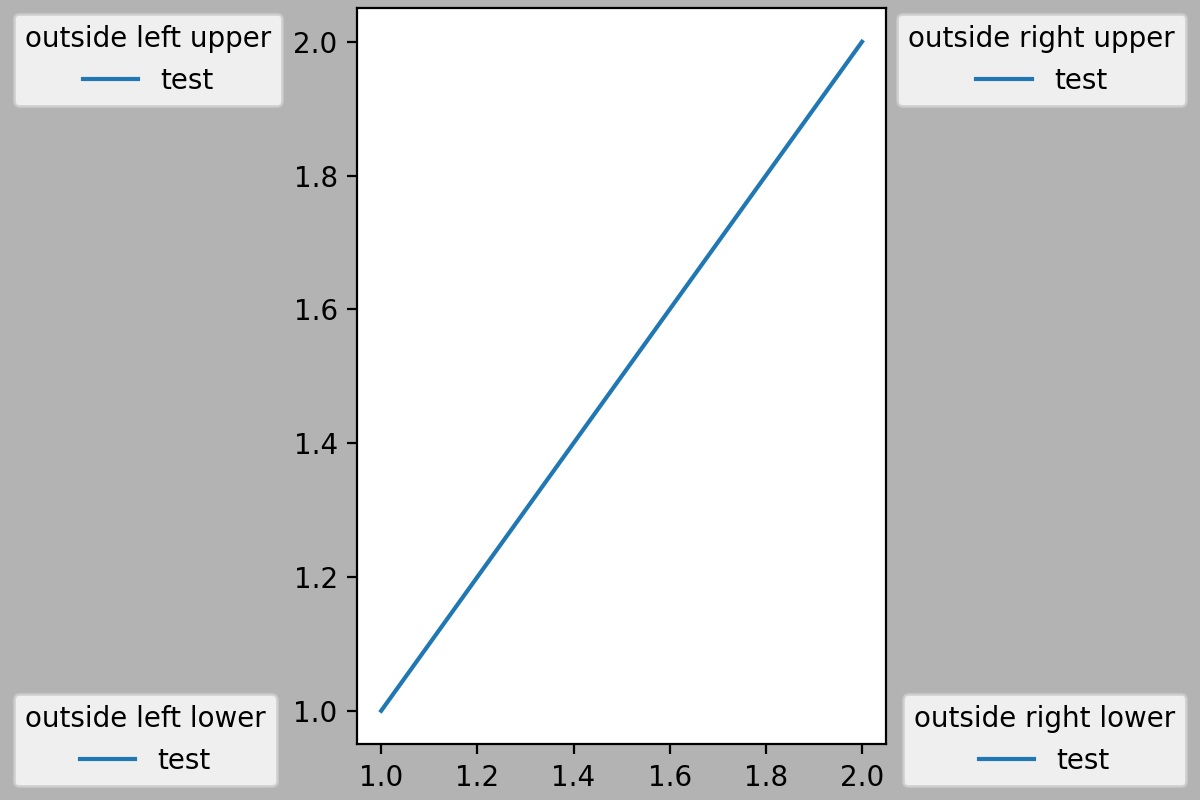
注意, 其中"outside right uppe r" 不同于 "outside upper right"。示例如下:
ucl = ['upper', 'center', 'lower']
lcr = ['left', 'center', 'right']
fig, ax = plt.subplots(figsize=(6, 4), layout='constrained', facecolor='0.7')

ax.plot([1, 2], [1, 2], label='TEST')
# Place a legend to the right of this smaller subplot.
for loc in [
        'outside upper left',
        'outside upper center',
        'outside upper right',
        'outside lower left',
        'outside lower center',
        'outside lower right']:
    fig.legend(loc=loc, title=loc)

fig, ax = plt.subplots(figsize=(6, 4), layout='constrained', facecolor='0.7')
ax.plot([1, 2], [1, 2], label='test')

for loc in [
        'outside left upper',
        'outside right upper',
        'outside left lower',
        'outside right lower']:
    fig.legend(loc=loc, title=loc)
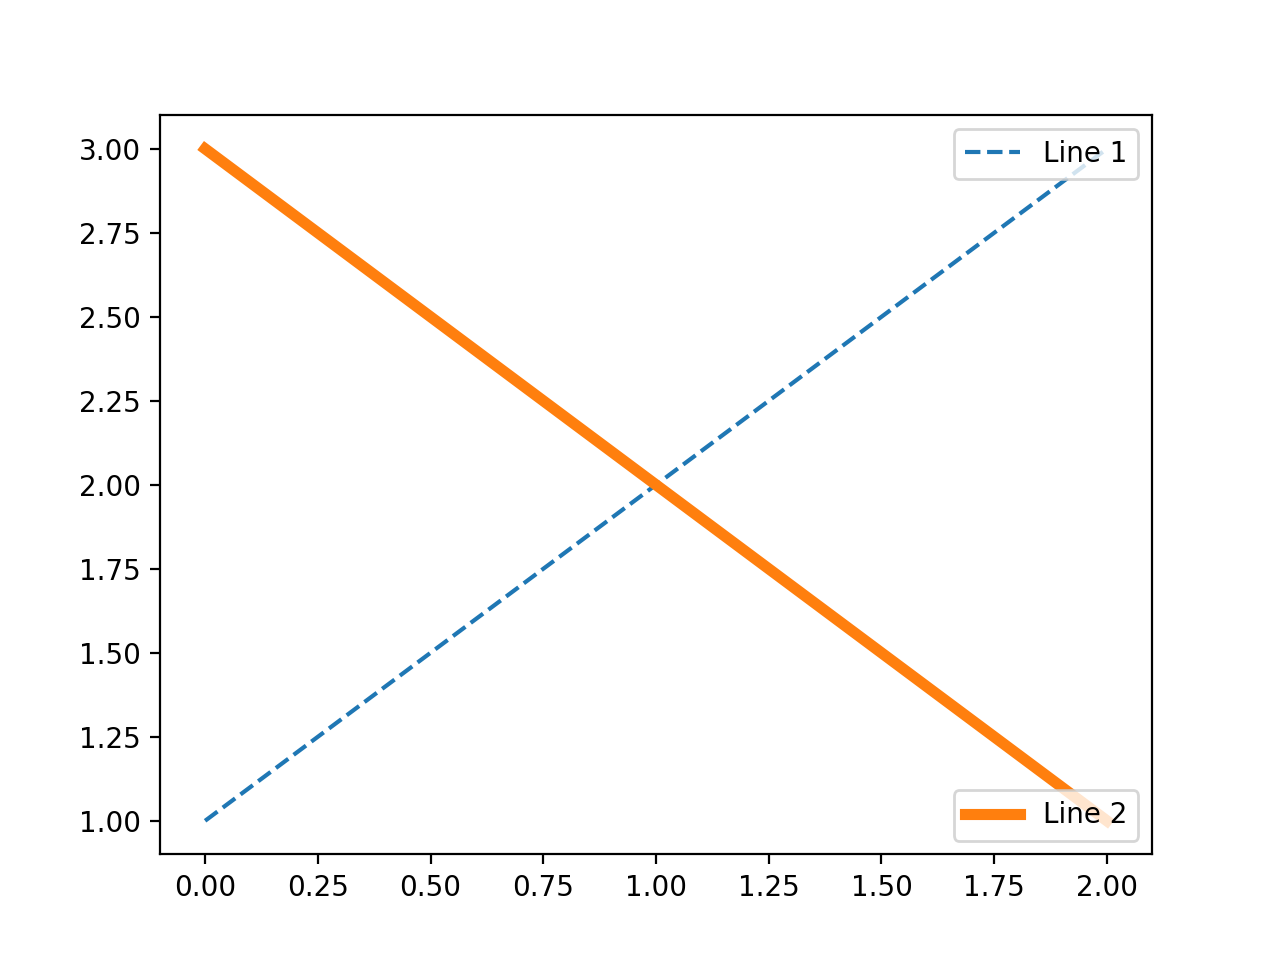
还可以在同一个Axes中使用多个图例。多次调用legend函数是无效的,你只会在图中看到最新设置的图例。应该将旧的图例实例手动加入到Axes中,具体方法如下:
fig, ax = plt.subplots()
line1, = ax.plot([1, 2, 3], label="Line 1", linestyle='--')
line2, = ax.plot([3, 2, 1], label="Line 2", linewidth=4)

# Create a legend for the first line.
first_legend = ax.legend(handles=[line1], loc='upper right')

# Add the legend manually to the Axes.
ax.add_artist(first_legend)

# Create another legend for the second line.
ax.legend(handles=[line2], loc='lower right')

plt.show()
更多操作 
更多坐标轴 
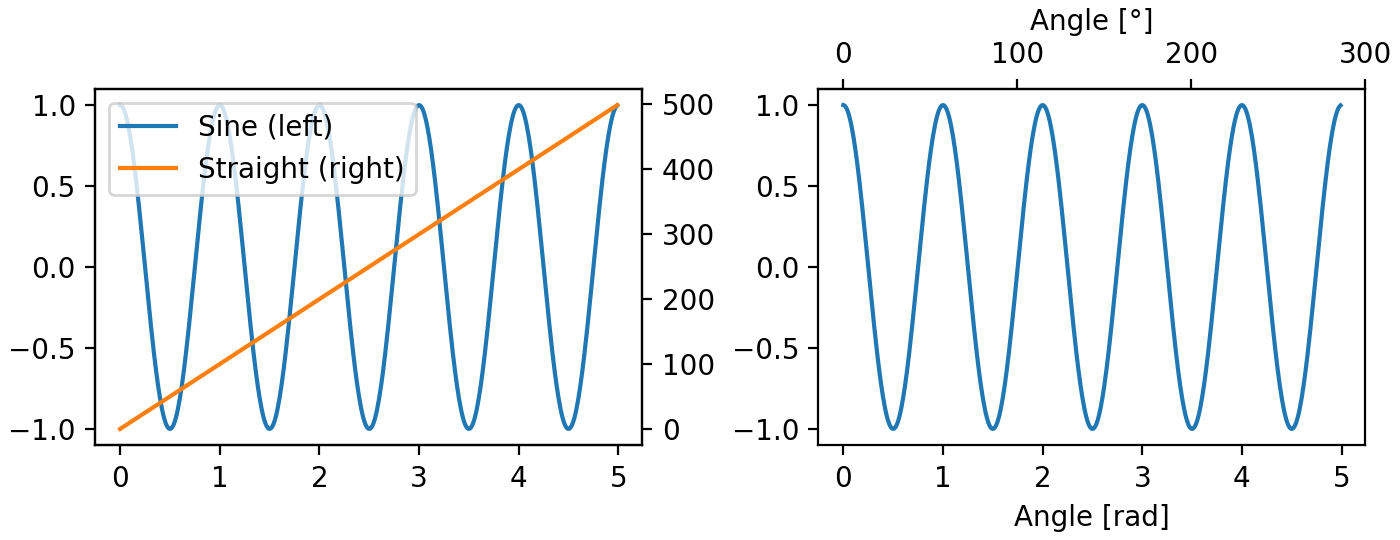
在同一张图表中有两组数量级不同的数据,有时可能需要额 外 的 y 轴,或者仅仅需要第二条单位不 同 的 x 轴。这种情况下,可以使用twinx以及twiny函数创建一个新的Axes,其中该新Axes与原来的Axes共用其中一条坐标轴。或者直接使用secondary_xaxis或secondary_yaxis添加第二条轴。
fig, (ax1, ax3) = plt.subplots(1, 2, figsize=(7, 2.7), layout='constrained')
l1, = ax1.plot(t, s)
ax2 = ax1.twinx()
l2, = ax2.plot(t, range(len(t)), 'C1')
ax2.legend([l1, l2], ['Sine (left)', 'Straight (right)'])

ax3.plot(t, s)
ax3.set_xlabel('Angle [rad]')
ax4 = ax3.secondary_xaxis('top', functions=(np.rad2deg, np.deg2rad))
ax4.set_xlabel('Angle [°]')
使用颜色映射展示第三维坐标 
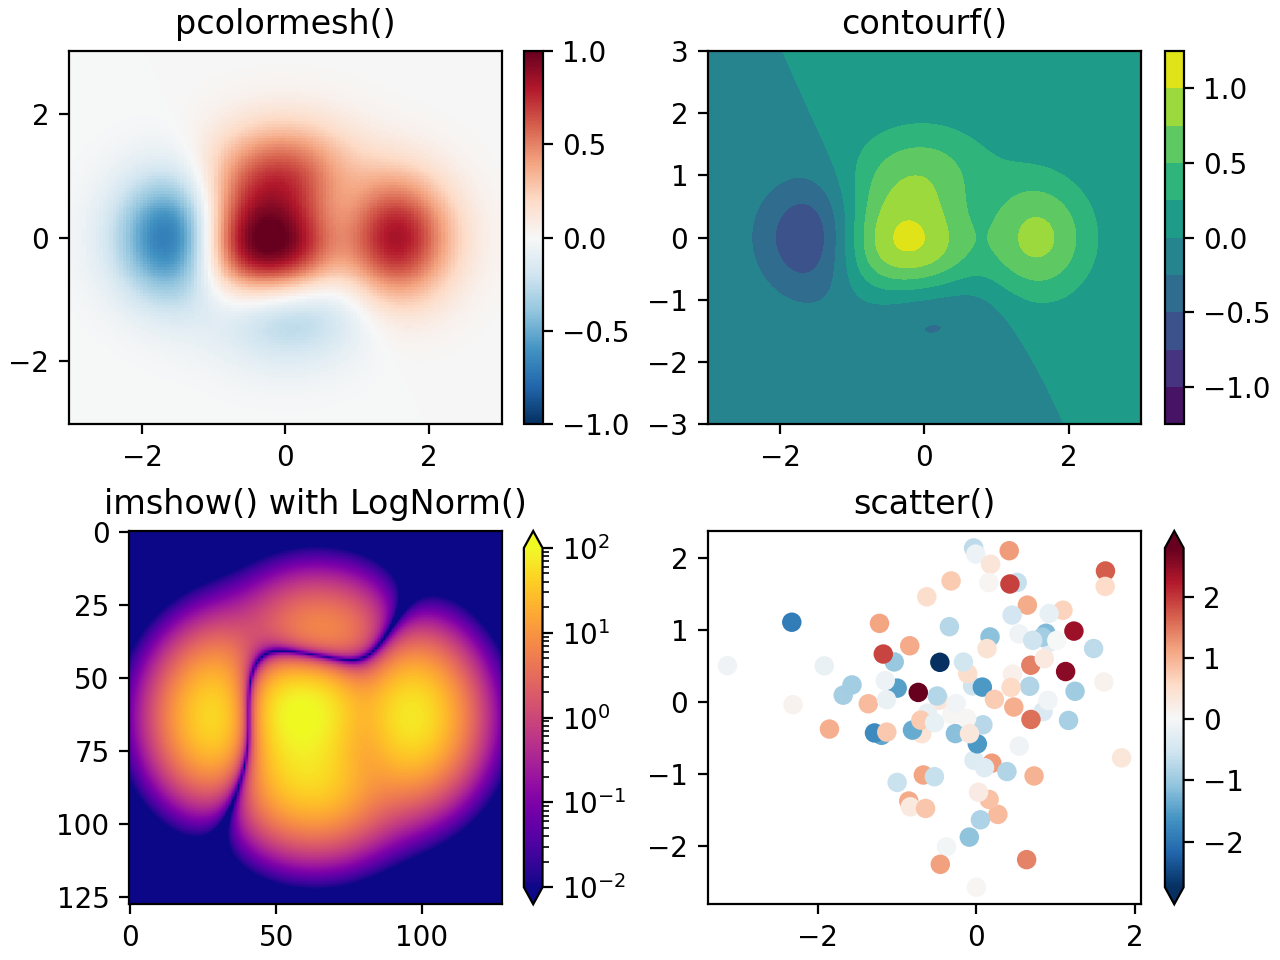
暂时仅作展示:
X, Y = np.meshgrid(np.linspace(-3, 3, 128), np.linspace(-3, 3, 128))
Z = (1 - X/2 + X**5 + Y**3) * np.exp(-X**2 - Y**2)

fig, axs = plt.subplots(2, 2, layout='constrained')
pc = axs[0, 0].pcolormesh(X, Y, Z, vmin=-1, vmax=1, cmap='RdBu_r')
fig.colorbar(pc, ax=axs[0, 0])
axs[0, 0].set_title('pcolormesh()')

co = axs[0, 1].contourf(X, Y, Z, levels=np.linspace(-1.25, 1.25, 11))
fig.colorbar(co, ax=axs[0, 1])
axs[0, 1].set_title('contourf()')

pc = axs[1, 0].imshow(Z**2 * 100, cmap='plasma',
                          norm=mpl.colors.LogNorm(vmin=0.01, vmax=100))
fig.colorbar(pc, ax=axs[1, 0], extend='both')
axs[1, 0].set_title('imshow() with LogNorm()')

pc = axs[1, 1].scatter(data1, data2, c=data3, cmap='RdBu_r')
fig.colorbar(pc, ax=axs[1, 1], extend='both')
axs[1, 1].set_title('scatter()')
创建多个Axes 
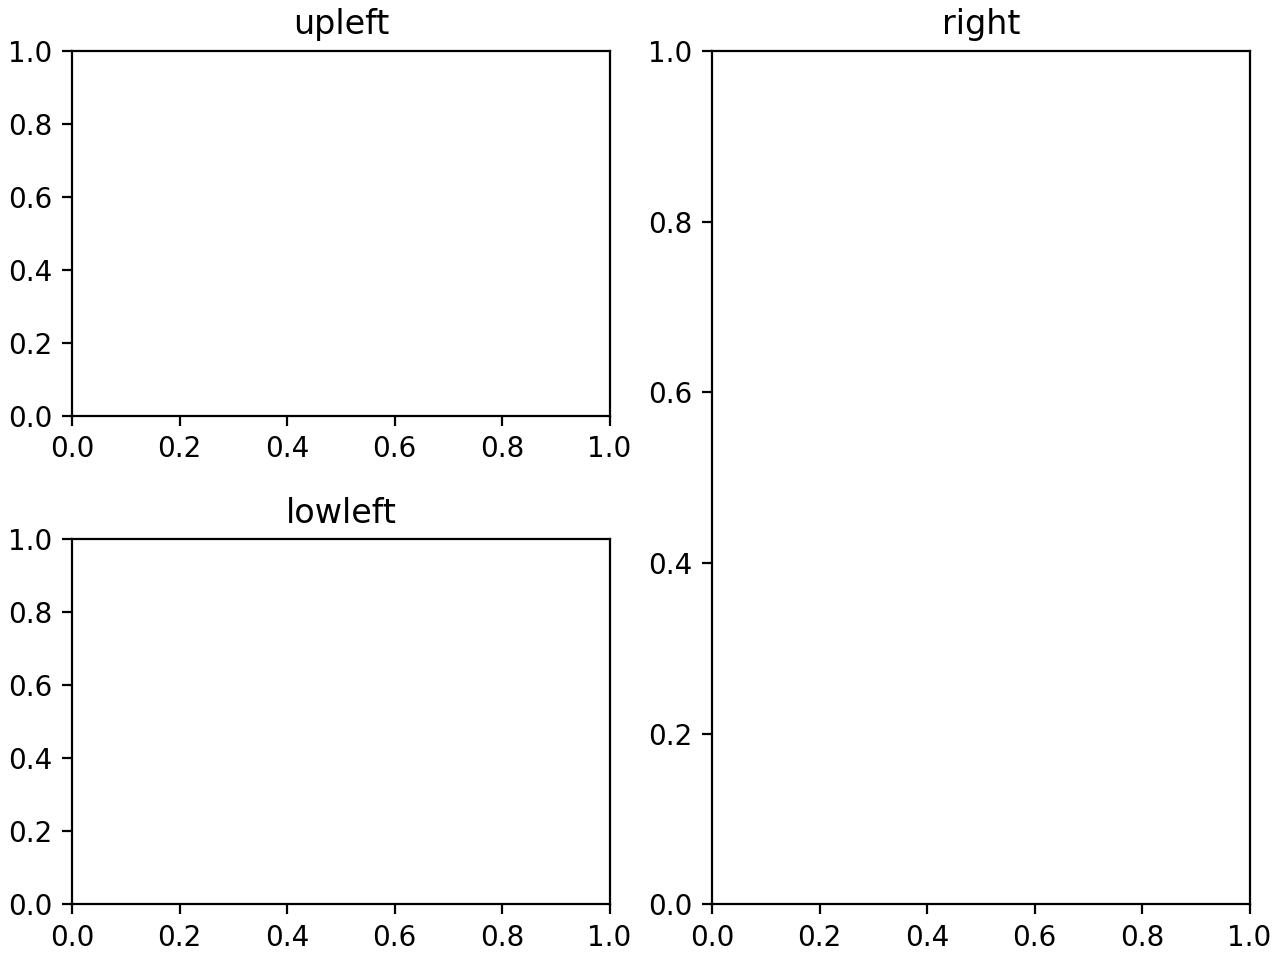
最基本的用法是多次调用plt.subplot()或fig2, ax = plt.subplots()。也可以使用其他方式实现更复杂的布局。例如使用subplot_mosaic函数可视化地构造布局。
fig, axd = plt.subplot_mosaic([['upleft', 'right'],
                               ['lowleft', 'right']], layout='constrained')
axd['upleft'].set_title('upleft')
axd['lowleft'].set_title('lowleft')
axd['right'].set_title('right')
还可以用'blank'或者'.'表示空白区域。
总结 
这里大概仅包括了一些基本操作,事 实上matplotl ib 的功能远远不止于此,不过这些部分也已经够大多数情况下的使用了, 更多的操作,以后再来探索吧!